We must’ve lost during the bye week because we have lost all our votes
1 Like
BEYOND STUPID VOTERS
Yep, stupid voters. 
May be bc NMU got swept
1 Like
Bonk, Thanks for the info
Small sample size but
https://x.com/rms_hockey/status/2110053367934251198?s=46&t=iks34uxihN5C4hJJ57kxog
2 Likes
I read nothing into this chart other than we played a bad team and got goalied. It’s a single data point so I’m not sure what conclusions anyone can draw. Let’s see what this chart looks like in December.
Back to lurking.
OK, I was a bit surly in my comment above, apologies. Here’s why I rolled my eyes at that chart. This chart is showing expected goals for and against on the x and y axis. The statisticians have done an analysis of every shot ever taken (as far as the data exists) and figured out how many times it resulted in a goal. So if Baker takes a shot from the weak side just outside the blue paint you’d expect him to score a lot more times than if he blasted one from the half wall. This chart shows that at even strength (no PP or PK) we expected to score a little more than 4 times per game while only expecting to give up less than a goal a game. It’s saying we generated a lot of good chances but we know based on the game scores we didn’t convert at that same rate. So our actual to expected is, well, actually negative which is not good. On the chart Northern is a mirror image of us. They didn’t generate much offense so their expected goals for are bad (while our expected goals against are good) and vice versa. Lastly, if you look at the actual vs. expected goals allowed for Northern’s goalie you’ll see he stopped a ton more than he should have. Hence the term “we got goalied.”
There’s a lot more going on with this stuff so there are a couple of things that aren’t 100% here but I tried to simplify it as much as possible so that people get the gist. Make sense?
Back to lurking.
Edit: Here’s a shot chart from the first game showing we had 7 shots on goal with an expected goal >.01 and the Northern goalie stopped them all.
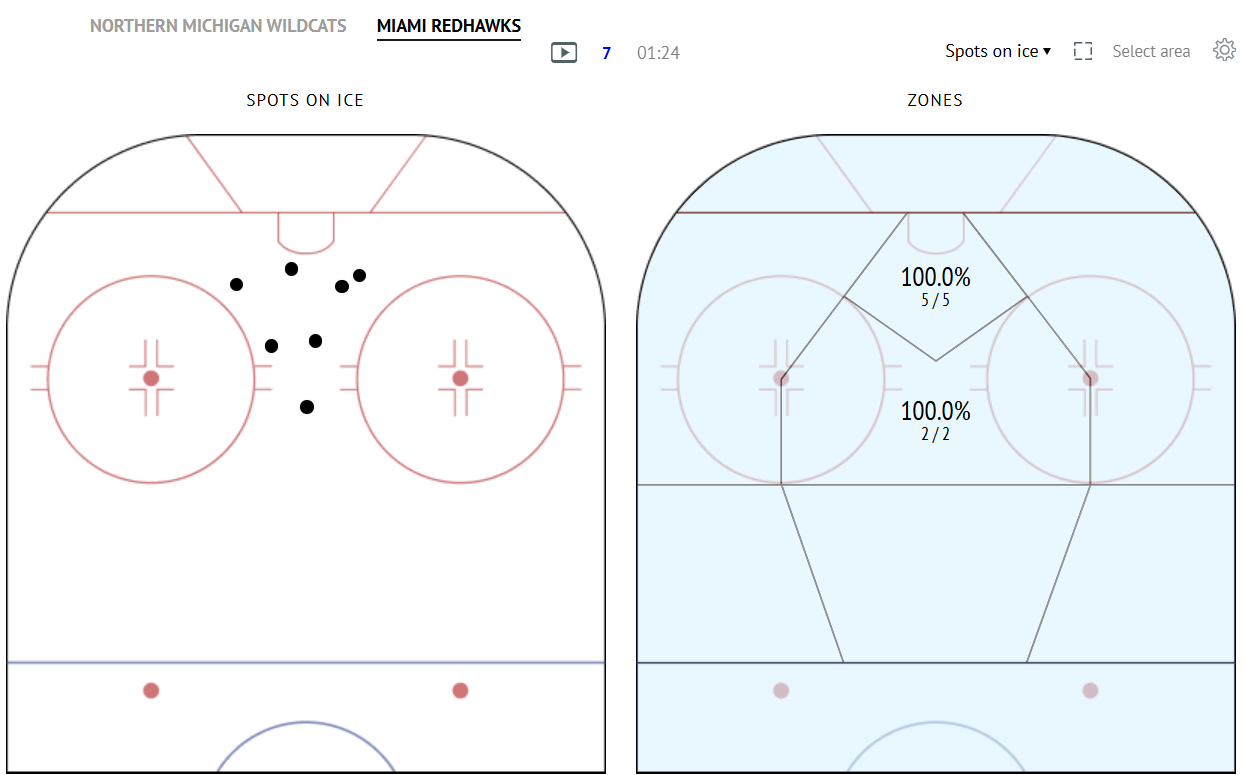
My other issue with expected goal metrics (although this probably only applies a little to our first game, more in general) is that there is a real world score that teams know and see. If a team goes up by 2 or 3 goals, they’ll be more content to park the bus sometimes and prioritize possession over taking shots, reducing their overall expected goals. But they got the real world goals that matter.
It’s a good long term trend metric. But one doesn’t get clicks by using it that way.
Yeah that’s why I said small sample size. Other teams have also played more games than us.
I just like spreading Miami propaganda if it looks good for us
I’m curious what kind of attendance Miami is going to have tomorrow night. Weird Thursday game, not a weekend night for the students, tough drive for out-of-towners.
Also it was a split home-and-home, and they were off last weekend. Seems like it could have split into two weekends rather than a Thursday game
1 Like
We could’ve also done a Friday Sunday series instead
For whatever reason Robert Morris must prefer this format. It started when these teams met in 2006, which went well.
The other two series against them did not. At all.
Arizona State officially fired Greg Powers and hired Dave Hakstol. To mix sporting metaphors, this is a grand slam coaching hire. Expect the Sun Devils to be fighting for home ice, league trophies and NCAA at-large bids. With the resources available to him plus the intangibles of being in Arizona, Hakstol will have these guys at the Michigan/Michigan State/Denver/Nodak level in 2-3 years max, maybe as early as next year. Noreen’s path to the top just got a little bumpier but we gotta stick to the plan and make it happen.
Back to lurking.
1 Like
Jimmy Mullin stays on his staff. Which tells me he wasn’t there the day of the workout, as the other 2 assistants were placed on leave.
I’d imagine more people are going to get the axe soon there. Support staff. Sports med.
35 votes in the USCHO poll, good for 24th