Credit to JRDex for bringing this to my attention.
6 Likes
We dropped from 58 to 65 in the NET after beating WMU by 11. Akron dropped 6 spots from 50 to 56 after beating CMU by 13. Goes to show that we need to beat these MAC bottom feeders by 20+ at home to maintain our NET.
The bigger factor is the NET doing what it was designed to do, which is juice the big conferences once conference play starts.
Almost every game for big conferences now is a quality opponent so they’ll start jumping the mid major and small schools who creeped into the top 50-60 as small schools have basically no quality games to add. NET is built to like a .500 SEC team more than a 17-1 MAC team.
I don’t think we could go up much even beating the bottom of the MAC by 20.
4 Likes
Since the NET formula isn’t publicly available, I am not sure what would’ve happened if we beat WMU by 40 (like Iowa did) versus beating them by 11. But I have to think our NET ranking wouldn’t have dropped if we won by 40.
The big conferences have the advantage in that they get Q1 and Q2 games almost every night during conference play. And ultimately, the committee doesn’t care as much about your NET ranking (as long as your in the top 40-50) as they do about your Q1 wins.
thats not how it works.
How does it work? I’m genuinely curious.
Would love more information about how NET works then. The formula isn’t pubically available, but the NCAA website says the following:
“The NET includes more components than just winning percentage. It takes into account game results, strength of schedule, game location, net offensive and defensive efficiency, and the quality of wins and losses.“
Wouldn’t margin of victory be factored into the Net offensive and defensive efficiency piece of the calculation? Obviously pace would play into that too.
It seems to me that SOS is a big factor for NET. For example, Akron is 11-4 and ranked #56. They have no Q1 or Q2 wins, but they have played 4 teams in those quads. Miami is 16-0 and ranked #65. We have played zero Q1 teams and are 3-0 against Q2 teams. So just by playing and losing to more highly ranked teams, the Zips are above us despite their best win being against #199 Iona.
Had we gotten blown out by Michigan and Duke, our NET would almost certainly be higher than blowing out UAPB and Maine. I know they want to reward teams for playing a tough schedule, but losing by 40 to a Q1 team shouldn’t benefit you as much as it does.
1 Like
It factors in everything: who you played, where you played and how close the game was. Akron has played 13 D1 games, so the Purdue game is only 1/13 of their NET calculation. It helps that they only lost to Purdue by 18 on the road. If they had lost by 40, their NET would be worse. But it also helps that they beat 5 teams in the NET 173-218 range by 14-24 points. It also helps that they beat Princeton by 35 and Evansville by 38.
Their NET dropped when they only beat CMU by 13 at home. CMU is the worst D1 team they played all year.
Woah Woah Woah!
Where’s Wright State on that list?
2 Likes
Here’s info on how the NET is computed and works (margin of victory/defeat is just a small piece and is capped so worrying that we are “only” beating teams by 11 instead of 25-30 is immaterial) hope this helps everyone:
The NET combines two equally weighted components:
Component #1: Team Value Index (TVI) (50%)
TVI measures how valuable your wins and losses are, given:
- Who you played, where you played, whether you won or lost
Key TVI Features
-
Game Location Weighting
-
Road wins are worth more
-
Home losses are penalized more
-
-
Opponent Strength
- Beating strong teams matters more than beating weak teams
-
Binary Outcomes
- Only win/loss matters here — margin of victory is irrelevant
Think of TVI as the NET’s resume strength component.
Component #2: Adjusted Net Efficiency (50%)
This measures how well you actually play, per possession, adjusted for:
-
Opponent quality
-
Game location
How Efficiency Is Calculated
-
Offensive Efficiency = Points scored per 100 possessions
-
Defensive Efficiency = Points allowed per 100 possessions
-
Net Efficiency = Offensive − Defensive
Margin of Victory (MOV)
-
Included only here but capped to prevent running up the score (roughly 10 points per game)
-
Emphasizes consistency and dominance, not blowouts
This side of the NET rewards teams that consistently outperform opponents, even in losses.
1 Like
I didn’t realize this needed to be said, but there is a very strong correlation between margin of victory and Offensive and Defensive efficiency. So when I said that winning by more points will help our NET, it’s because a higher margin of victory is the direct result of better offensive and defensive efficiency metrics.
Yes, that is correct however in NET computations the MOV is capped at roughly 10 points. No difference in the NET rating formula if you win by 20 or 30 vs 10. That is purposely done to decrease the need to “run up the score”. And the MOV component is not weighted as heavily in the overall formula as many believe. In addition the effeciency components are adjusted for opponent strength and game location so it is not a “pure” net rating of the two.
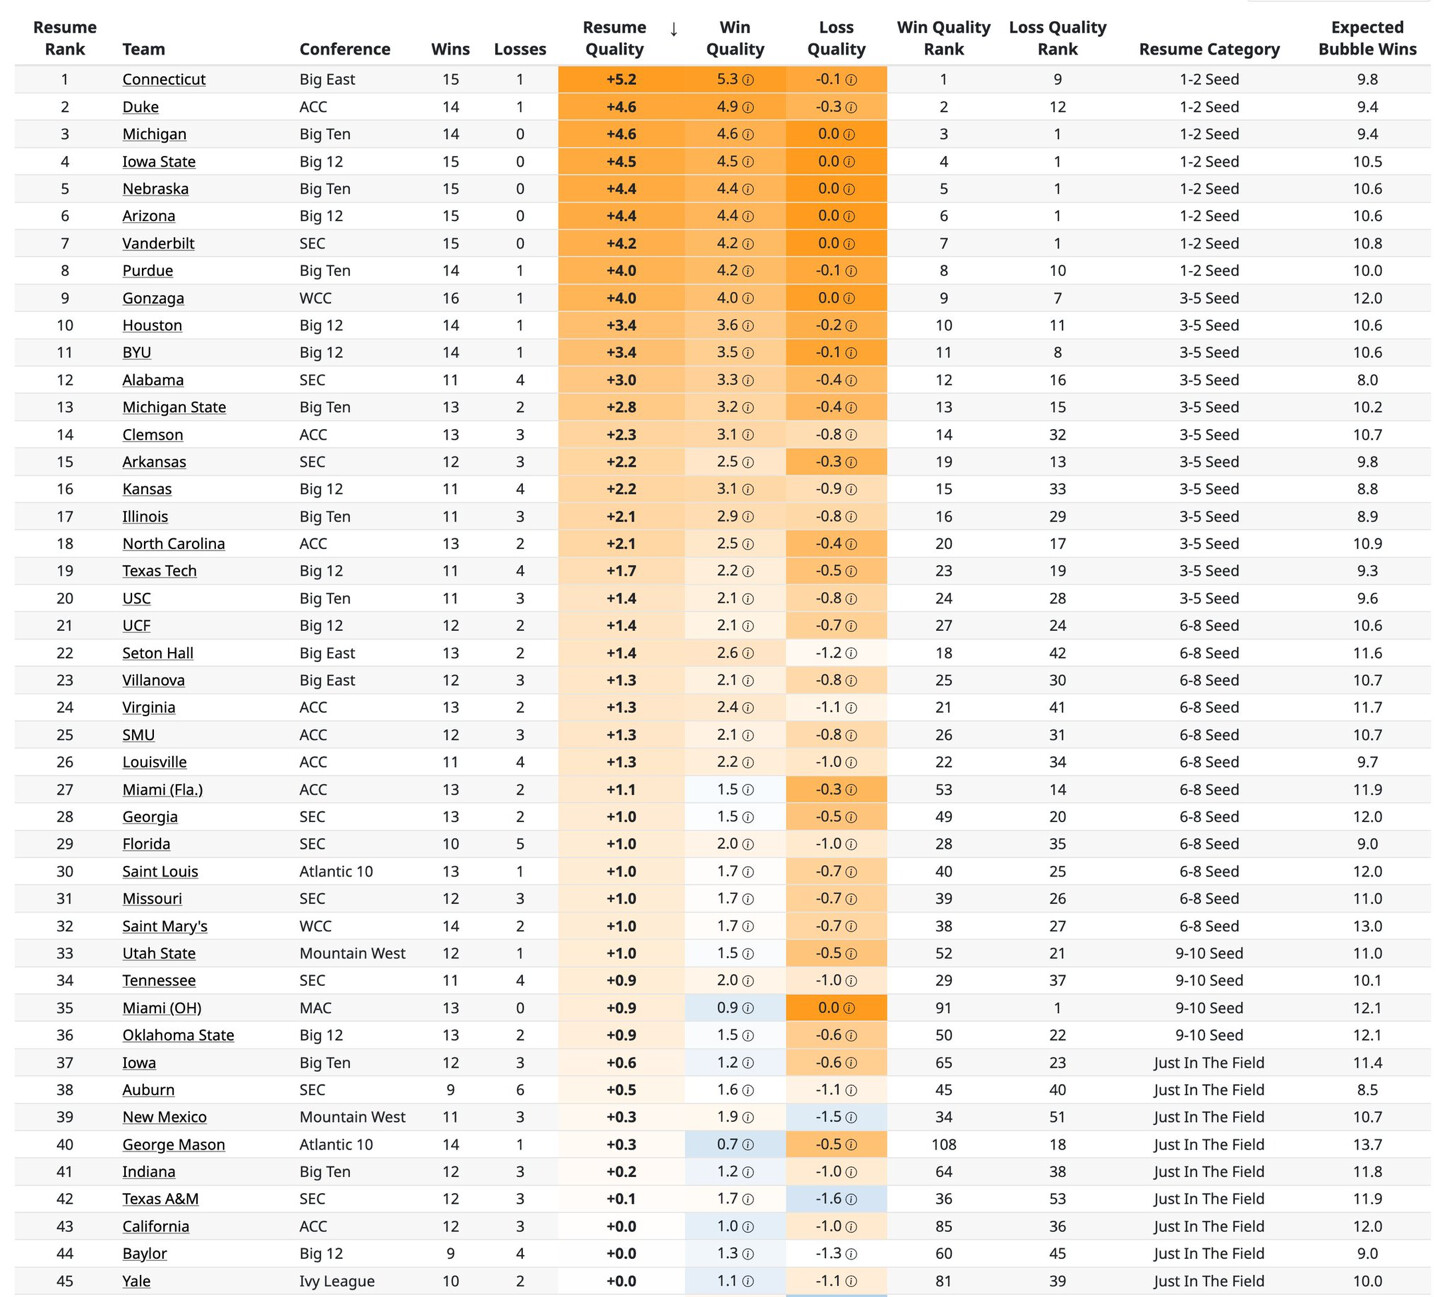
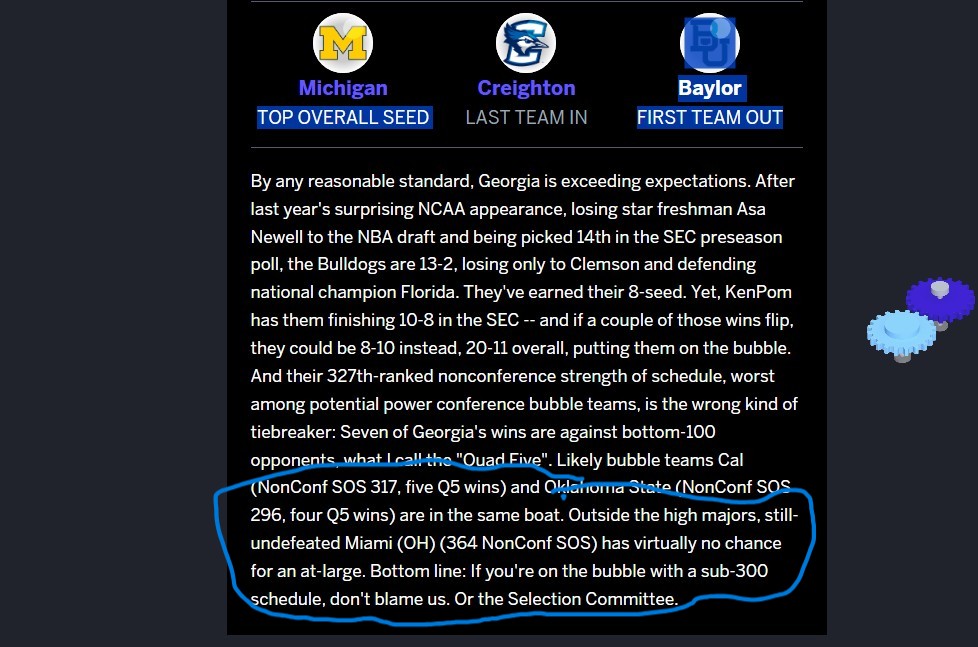
And all of this discussion of Miami’s KenPom/NET is immaterial–as Joe Lunadri of ESPN Bracketology just posted regarding Maimi’s chances of an at large–No chance no matter their final record.
Would be nice to enter the MAC Championship game with only a loss or two and at least create an at-large conversation and grab some heavy media discussion about whether Miami deserves a spot or not.
1 Like
Hopefully we just win in Cleveland and never find out, but I’m 100% sure if we go undefeated and then lose in the MAC finals: we would get an at large to at the very least play in Dayton.
We would have been ranked for two months or close at that point and likely a top 15 team. Our NET would be semi respectable and we would have gotten months of press.
I think 2 losses (1 reg season and semis or finals) gives us a chance depending on who and how bad. Anything beyond that and no shot.
4 Likes
Where did he post that?
I’m first to give that nerd Lunardi a wedgie. Learn ball, dweeb. Nice toupee.
3 Likes
If you want to find the most accurate bracketologists, it can be found here.
The Bracket Project - Ranking the Bracketologists
You’ll see that Lunardi is the one of the least accurate bracketologists, not from the number of teams he gets right but how he seeds them. I stopped following Lunardi awhile ago.
2 Likes