I noted on the Clemson thread that I was curious on what the long-term potential for Miami football/basketball are given that we have to support DI hockey as well. To dig deeper I pulled win/loss/tie data for the fifteen seasons from 2006-07 through 2020-21 for the sixteen colleges that sponsor FBS football and DI hockey/basketball (and 1996-2005 Miami data to review the pre-B2 era). A few general notes before I get into some observations in subsequent posts that I drafted separately:
Records for 2021-22 thus far were not included
The 16 schools included are split between 9 teams in football/basketball power conferences, 6 in non-power, and UConn (non-power football since 2013); I only counted Arizona State/Penn State hockey and UMass football data once they were officially DI/FBS
Hockey ties were basically counted as losses since they weren’t wins (points percentage is a better way but then it wouldn’t be consistent with the other sports)
When looking at football/basketball/hockey winning percentage by school I used an average of the three to get around each sport playing a different number of games (not perfect, but generally helpful)
Disclaimer that this isn’t meant to be scientific, though I do think there are some interesting trends
Since 2006-07, the sixteen teams sponsoring the sports analyzed finished with an average yearly winning percentage of 0.531 across the three (0.566 in basketball, 0.555 in football, and 0.472 in hockey); there’s a big difference between the power team average (0.616, 0.635, and 0.503 respectively) and non-power (0.477, 0.422, 0.430)
The schools with the highest overall averages were OSU, Wisconsin, Notre Dame, and Michigan (all above 0.600); the lowest were UMass (0.376), Army (0.413), and UConn (0.414). Arizona State was the only power below .500 but only because hockey lost a lot as a startup
Only one of the seven non-power colleges had an overall winning average in the period (Air Force at 0.503, they were also the only with a winning record in two of the three sports)
Since 2016-17, two of the seven non-power programs had an overall winning average (Army at 0.528 and WMU at 0.509, both helped by good football); only BG managed to have a winning record in two of three sports (basketball/hockey)
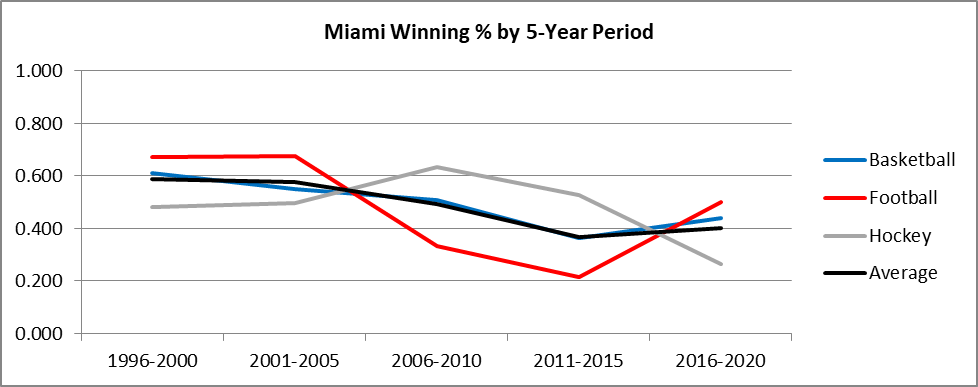
From 1996-97 through 2005-06 we had an average winning percentage of 0.582 (0.675 football, 0.581 basketball, 0.489 hockey); no surprise, but after that our football/basketball fell off a cliff while hockey surged. In the past five years hockey has collapsed, football is exactly .500, and basketball just barely inched above .400 (see first chart)
Miami had winning records in football/hockey/basketball the same athletic year five times since 1996-97, but none since 2005-06; we didn’t have a single winning record in any of the three between hockey in 2014-15 and football in 2019-20
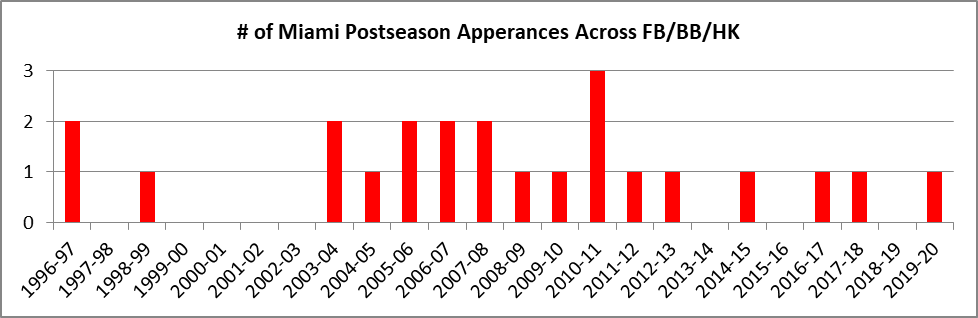
In five of the eight years between 2003-04 and 2010-11 we had multiple teams make postseason appearances the same athletic year, though since then we’ve had no such seasons (see second chart). We would’ve made a lot more bowls and minor basketball tournaments in the late 90s/early 00s if they were as prevalent back then
In the past five seasons we were the only non-power college out of seven that did not have at least one program between football/hockey/basketball above .500
It’s not easy for a non-power conference school to average a winning record between football/hockey/basketball for long periods, but WMU did it over a five-year stretch (BG would’ve too if they weren’t awful in football recently) so we should be able to at least hit that
It’s not impossible for Miami to win big in two of the three sports and remain competitive in the third as shown in the 90s/early 00s, but Miami and the college sports landscape have changed drastically since then; I’m not sure how realistic it is to expect that in the near-term, much less winning records from all three of them over a long period unless there’s a fundamental change in our athletic department or financial situation
Based on the fact that basketball has received basically no facilities investment since Sayler became AD and he dragged his heels to get rid of Cooper, one has to wonder if he’s seen data like this. It’s not impossible to imagine that he determined that we’re unlikely to maintain a winning program across all three sports and decided that basketball was the odd man out; of course even if that was the case it hasn’t worked out when football is only .500 and hockey is still in the doldrums
It’s not easy for a non-power conference school to average a winning record between football/hockey/basketball for long periods
Is it hard because sponsoring all three sports drains resources or just because having sustained success across three sports is random/difficult? I think it’s a bit of both.
It’s not impossible to imagine that he determined that we’re unlikely to maintain a winning program across all three sports and decided that basketball was the odd man out
I think this is probably accurate, and honestly the right choice in my opinion. In terms of balancing getting publicity for the university and generating student interest in athletics, Football and Hockey are the two to focus on. Of course, a new basketball arena would be great but it doesn’t seem there is the money for it.